Persistently high inflation and its naturally accompanying impact on central bank policy have dominated the narrative for markets so far this year. The impact of this strong hawkish shift and aggressive monetary tightening has been felt far and wide, with fairly indiscriminate selling seen across different asset classes and geographic regions.
Chart 1: Negative start to 2022 for most markets
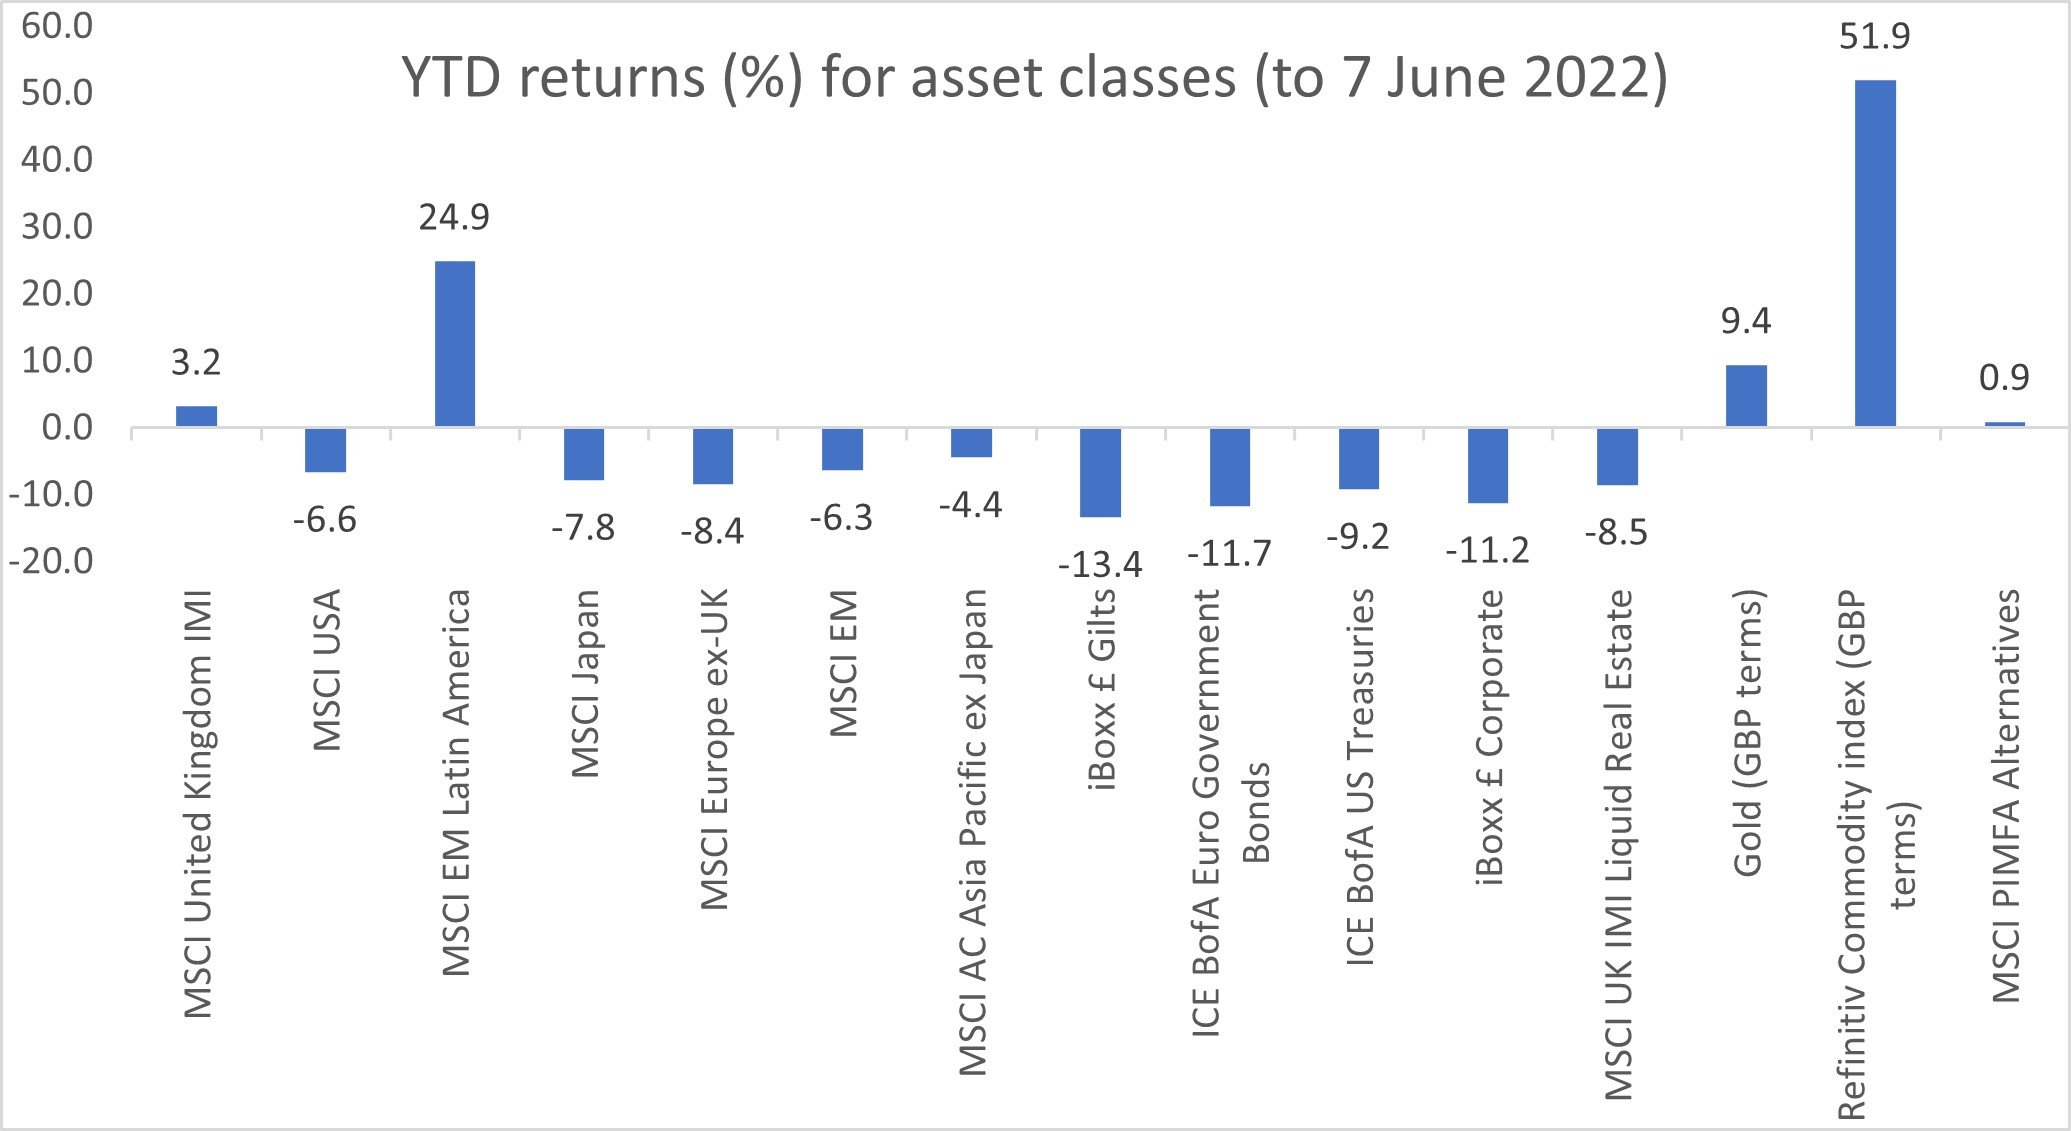
Source: Refinitiv Datastream 07/06/2022
As of 7th June, the majority of stock and bond markets were in negative territory for the year. Commodities have been a standout performer, rising on a bullish combination of pent-up demand and supply disruptions – disruptions that the Russian invasion of Ukraine have threatened to exacerbate. The gains have been further boosted in GBP terms due to the sizable drop in the sterling versus US dollar rate, a move that accounts for the bulk of Gold’s returns.
The selling has come largely in the form of derating, as earnings multiples have compressed due to less buoyant sentiment. While prices have fallen, earnings estimates are marginally higher than at the start of the year, boosting the denominator in price/earnings (P/E) calculations and causing the output to fall further. Looking at the MSCI country indices, the latest 12-month forward P/E ratios have fallen below their 10-year average.
Chart 2: Valuations have compressed below 10-year average
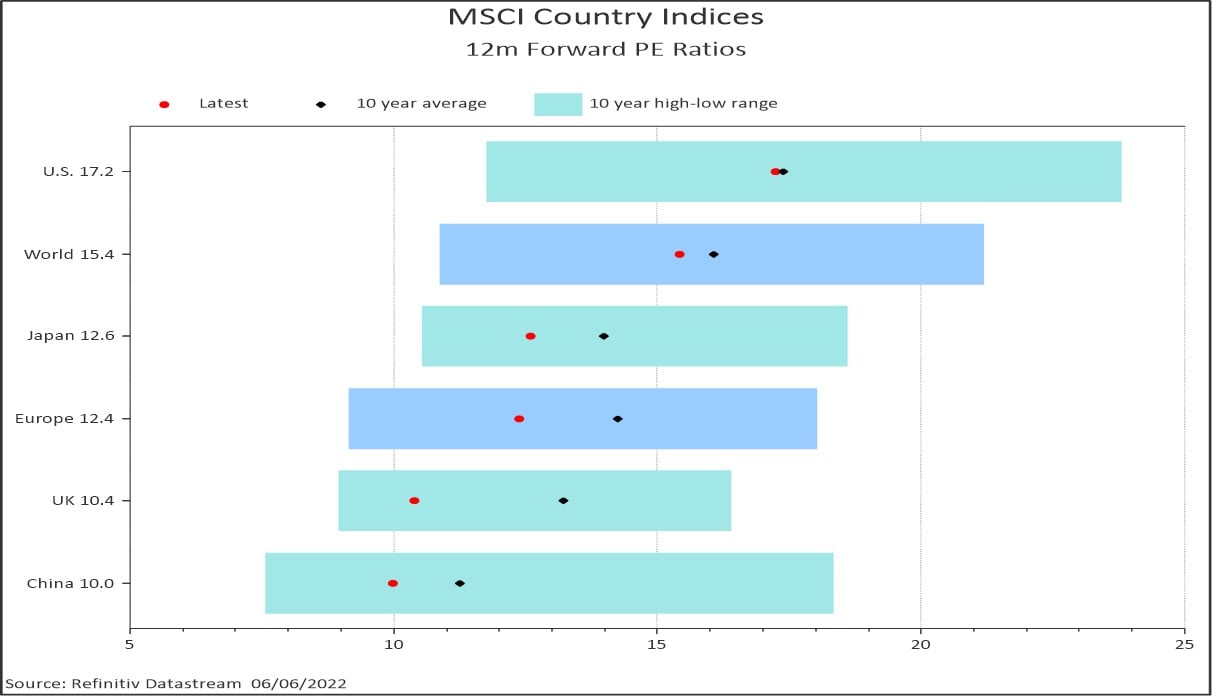
This shows that investors are now willing to pay less per unit of earnings. Or put another way, stocks are cheaper than their 10-year average when viewed on a constant earnings basis.
Arguably the main reason for this derating has been sharply rising rates, which are symptomatic of the current environment. In 2022 the US 10-year Treasury yield has jumped, almost doubling from around 1.5% at the start of January. This yield has only seldom exceeded 3% over the past decade.
Chart 3: Yields are rising sharply, weighing on bonds and stocks
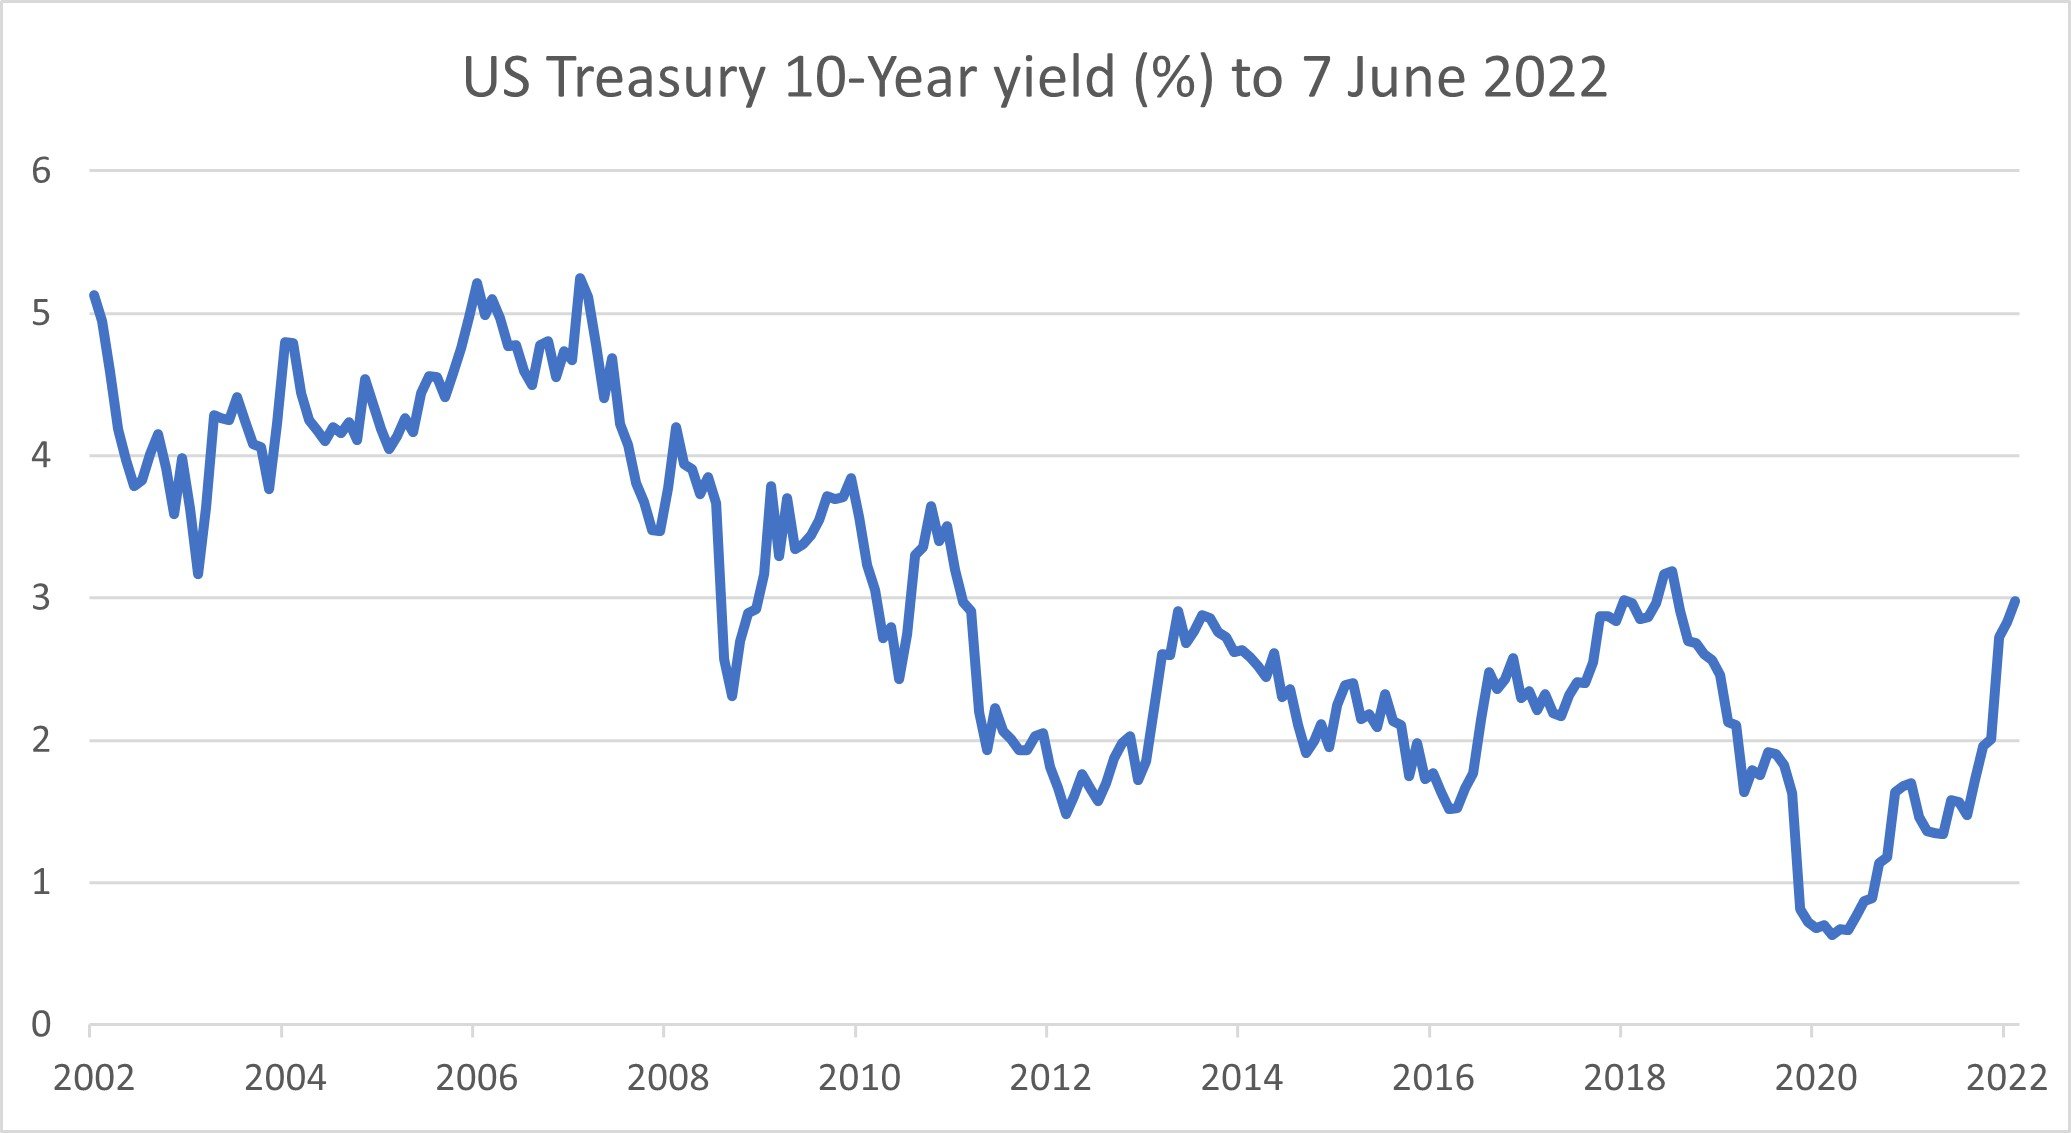
Source: Refinitiv Datastream 07/06/2022
The Federal Reserve have embarked on an aggressive hiking cycle, delivering the first 50bp increase in over two decades in early May and strongly hinting at two more 50bp increases at the next two meetings. Markets currently expect the fed funds rate to end the year around 2.8%, significantly higher than the current 1%. Furthermore, quantitative tightening (QT) - the reverse process of quantitative easing – began at the start of June, a move expected to put more upwards pressure on rates. The Fed plans to absorb cash, selling bonds or letting them mature, to the tune of US$47.5bn a month, in time increasing up to US$95bn a month, as it seeks to reduce its US$9tn of assets held on its balance sheet.
That said, it is important to note that a lot of this is arguably already in the price, and forward-looking markets may require a further shift towards an even tighter monetary policy than is currently expected to cause an additional downside catalyst for stock and bond prices.
Less supportive monetary policy is currently seen as negative for both stocks and bonds and is weighing on investor sentiment in a similar fashion to the end of the Fed’s last hiking cycle. That cycle, which ran from December 2015-2018, differed in many ways to the current period but a clear parallel can be drawn between the end of it and the past five months.
Chart 4: US stocks are following a similar trajectory to late 2018
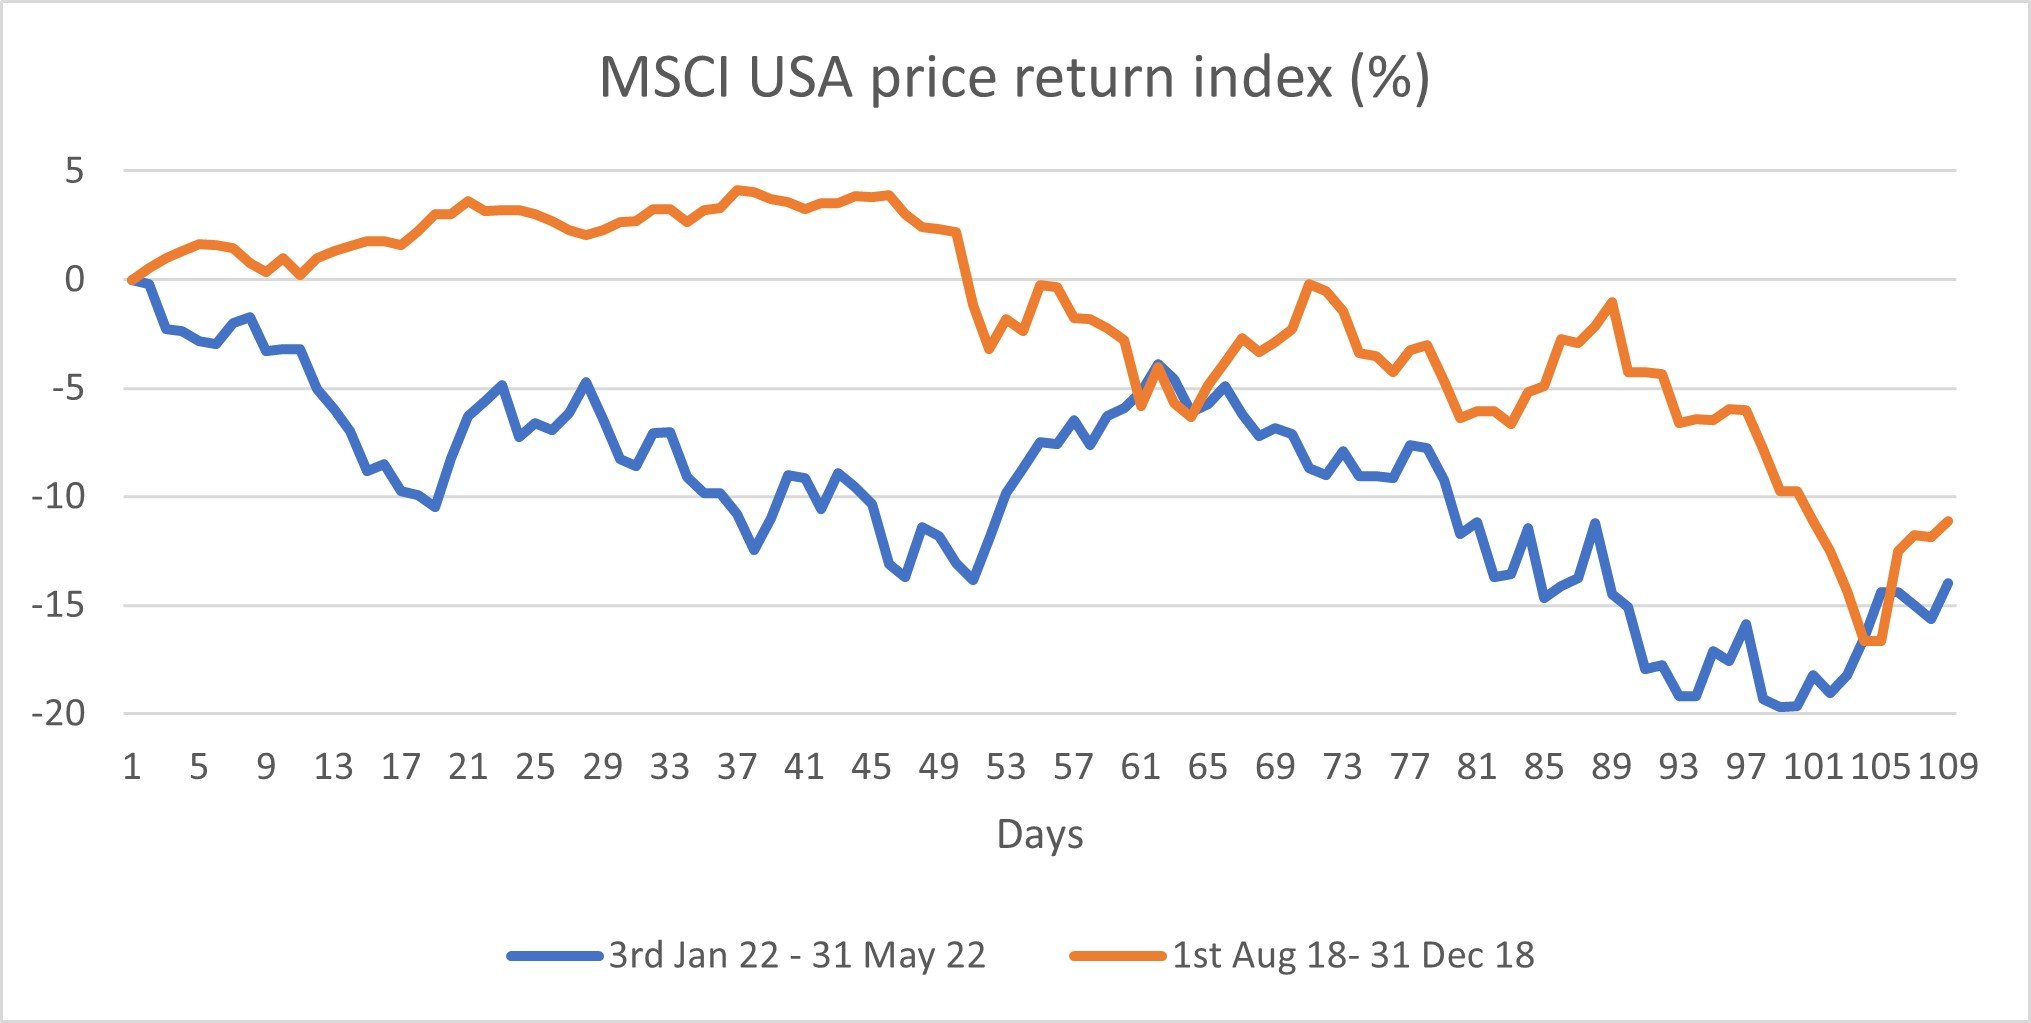
Source: Refinitiv Datastream 07/06/2022
Simply put, on both occasions market grew fearful that Fed policy would be too restrictive for near-term upside in equities and bonds. Former Fed chair Janet Yellen began hiking rates in a very cautious manner, delivering just one 25bp increase in each of 2015 and 2016. Jerome Powell succeeded Yellen in early 2018 and increased the pace of hikes, delivering four 25bp moves by year-end.
This raised concerns among investors that following a long period of accommodative monetary policy, it had become too restrictive – a narrative equally applicable to the current state of play. After hitting a new all-time high in August 2018, the following five months saw some sizable declines for US stocks. From 1st August the market fell on a closing basis by 16.7% before making a low just before year-end.
The size of the decline is comparable to the drop experienced thus far in 2022. Since the market hit its highest year-to-date level on 3rd January, it has experienced a peak-to-trough decline of 19.7% before recovering a little into the end of May, stopping just short on a closing basis of the most widely used definition of a bear market - a 20% peak-to-trough decline.
--
The following disclaimer is with regard to our distribution of data from MCSI indices to you, the recipient/user:
The MSCI information may only be used for your internal use, may not be reproduced or redisseminated in any form and may not be used as a basis for or a component of any financial instruments or products or indices. None of the MSCI information is intended to constitute investment advice or a recommendation to make (or refrain from making) any kind of investment decision and may not be relied on as such. Historical data and analysis should not be taken as an indication or guarantee of any future performance analysis, forecast or prediction. The MSCI information is provided on an “as is” basis and the user of this information assumes the entire risk of any use made of this information. MSCI, each of its affiliates and each other person involved in or related to compiling, computing or creating any MSCI information (collectively, the “MSCI Parties”) expressly disclaims all warranties (including, without limitation, any warranties of originality, accuracy, completeness, timeliness, non-infringement, merchantability and fitness for a particular purpose) with respect to this information. Without limiting any of the foregoing, in no event shall any MSCI Party have any liability for any direct, indirect, special, incidental, punitive, consequential (including, without limitation, lost profits) or any other damages. (www.msci.com)
Author
Oliver Harwood
Investment DirectorSubscribe to one of our newsletters
Get the inside view from Quilter Cheviot delivered straight to your inbox.